Hypothesis testing for differences between means and proportions
Hypothesis tests are normally done for one and two samples. For one sample, researchers are often interested in whether a population characteristic such as the mean is equivalent to a certain value. For two samples, they may be interested in whether the true means are different. Statistical hypothesis tests depend on a statistic designed to measure the degree of evidence for various alternative hypotheses. The process of hypothesis testing consists of following procedure:
- Making a statement of population.
- Sampling from population and analysing the sample data.
- While recognizing that some divergence between sample and population characteristics may be expected since sample is only a subset of the proportion to determine whether the difference between what is observed and statement made could have been due to chance alone and hence insignificant or they are significant casting a doubt on statement made.
Basically, hypothesis testing involves on examination based on sample evidence and probability theory to determine whether hypothesis is reasonable statement. A hypothesis refers to the statement or claim about the whole population. A sample is taken out from the population and analysed. Accordingly, in hypothesis testing, hypothesis or claim is made about whole population, sample is taken out from the population and analysed. Finally, the results of analysis are used to decide whether claim made is reasonable to be accepted as true (Vohra, 1929).
Elements of a hypothesis test:
- Null hypothesis: Statement regarding the value(s) of unknown parameter(s), typically imply no association between explanatory and response variables in our applications (will always contain an equality). The null hypothesis is H0.
- Alternative hypothesis: Statement contradictory to the null hypothesis (will always contain an inequality). The alternative hypothesis or research hypothesis is H1.
- Test statistic - Quantity based on sample data and null hypothesis used to test between null and alternative hypotheses
- Rejection region - Values of the test statistic for which we reject the null in favor of the alternative hypothesis
Another type of hypothesis is One- and two-tailed alternative hypotheses. A one-tailed (or one-sided) hypothesis specifies the direction of the association between the predictor and outcome variables. A one-tailed hypothesis has the statistical advantage of permitting a smaller sample size as compared to that permissible by a two-tailed hypothesis. Unfortunately, one-tailed hypotheses are not always appropriate.
Logic of hypothesis testing:
- Assume the Null Hypothesis (H0) is true
- Calculate the probability (p) of getting the results observed in your data if the Null Hypothesis were true
- If that probability is low (< .05) then reject the Null Hypothesis
- If researcher reject the Null Hypothesis, that leaves only the Research Hypothesis (H1)
Figure: Hypothesis testing
|
Data Analysis Outcome |
|
In population |
Accept Null Hypothesis |
Reject Null Hypothesis |
Null Hypothesis True |
Correct Decision |
Type I Error |
Null Hypothesis False |
Type II Error |
Correct Decision |
Steps in hypothesis testing:
- Set up null and alternate hypothesis: Null Hypothesis is statement about the value of a population parameter. Alternate Hypothesis is statement that is accepted if evidence proves null hypothesis to be false.
- Select the level of significance: When testing a hypothesis of a proportion, researcher use the z-statistic or z-test and the formula:
When testing a hypothesis of a mean, researcher use the z-statistic or we use the t-statistic.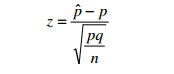
- Select test statistics.
- Establish the decision rule: The decision rules state the conditions under which the null hypothesis will be accepted or rejected. The critical value for the test-statistic is determined by the level of significance. The critical value is the value that divides the non-reject region from the reject region.
- Perform computations: When researchers use the z-statistic, they use the formula:
When using the t-statistic, researcher use the formula:
After that compare the computed test statistic with critical value. If the computed value is within the rejection region(s), researchers reject the null hypothesis; otherwise, they do not reject the null hypothesis.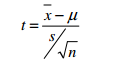
- Draw conclusion
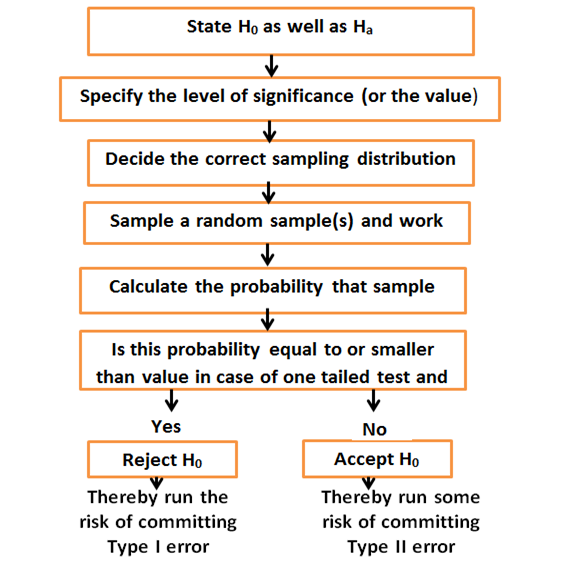
Figure: Flow diagram of hypothesis testing:
Types of hypothesis testing:
- Large Sample Tests, Population Mean (known population standard deviation)
- Large Sample Tests, Population Proportion (unknown population standard deviation)
- Small Sample Tests, Mean of a Normal Population
Errors in hypothesis testing: It may be observed from the way hypothesis for a test are formulated, the null and alternate hypothesis are competing statement about the true state of nature.
Type I error, also called "false positive": The error of rejecting a null hypothesis when it is actually true. In other words, this is the error of accepting an alternative hypothesis (the real hypothesis of interest) when the results can be attributed to chance. Plainly speaking, it occurs when we are observing a difference when in truth there is none (or more specifically - no statistically significant difference). So the probability of making a type I error in a test with rejection region R is 0, P (R | H0 is true).
Type II error, also termed as a "false negative": The error of not rejecting a null hypothesis when the alternative hypothesis is the true state of nature. This is the error of failing to accept an alternative hypothesis when researcher do not have adequate power. Plainly speaking, it occurs when we are failing to observe a difference when in truth there is one. So the probability of making a type II error in a test with rejection region R is 1-P(R |Ha is true) − P R Ha. The power of the test can be P (R | Ha is true).
Table: Difference in type 1 and type 2 errors:
Type 1 Error |
Type 2 Error |
|
|
|
|
|
|
|
|
|
|
Reducing Type I Errors: Prescriptive testing is used to increase the level of confidence, which in turn reduces Type I errors. The chances of making a Type I error are reduced by increasing the level of confidence.
Reducing Type II Errors: Descriptive testing is used to better describe the test condition and acceptance criteria, which in turn reduces Type II errors. This increases the number of times we reject the Null hypothesis – with a resulting increase in the number of Type I errors (rejecting H0 when it was really true and should not have been rejected). Therefore, reducing one type of error comes at the expense of increasing the other type of error.
Testing hypotheses for difference between means: Testing differences two or more means is commonly used in experimental research. The statistical technique used when testing more than two means is called the analysis of variance. The hypothesis testing procedure for differences in means differ depending on the following criteria (Aaker, 2008):
- Whether the sample obtained from unrelated or related samples.
- Whether the population standard deviations are known or not known.
- If the population standard deviations are not known whether they can be used to be equal or not.
The logic behind the hypotheses test and the basic concept of the tests remain the same for above conditions.
Testing hypotheses for difference between proportions: It is normally important to test the difference between two population proportions. The first step in hypothesis test for difference in proportion is to calculate the standard error of the proportion using the hypothesized value of defect free and defective items (Aaker, 2008).
Advantages of Hypothesis Testing:
- Hypothesis Testing is well suited for comparing a treatment with the control.
- It is relatively simple to calculate.
Pitfalls of hypothesis testing: In hypothesis testing, Statistical significance does not imply a cause-effect relationship and it interpret results in the context of the study design. Hypothesis testing is dependent on concentrations tested. Statistical power is influenced by variability. In Hypothesis testing, research is unable to calculate confidence intervals. It is confounded by poorly behaved data and frequently need to use non-parametric statistical methods.
To summarize, Hypothesis testing also called significance testing is a technique for testing a claim or hypothesis about a parameter in a population, using data measured in a sample. In this method, researcher test some hypothesis by determining the likelihood that a sample statistic could have been selected, if the hypothesis regarding the population parameter were true. The hypotheses are specified, an α-level is chosen, a test statistic is calculated, and it is reported whether H0 and H1 is accepted. In practice, it may happen that hypotheses are suggested by the data, the choice of α-level may be ignored, more than one test statistic is calculated, and many modifications to the formal procedure may be made (Berger, 1982). It is documented that hypothesis testing enables researcher to quantify the degree of uncertainty in sampling variation, which may account for the results that deviate from the hypothesized values in a particular study.