Inferential Statistics
What is inferential statistics?
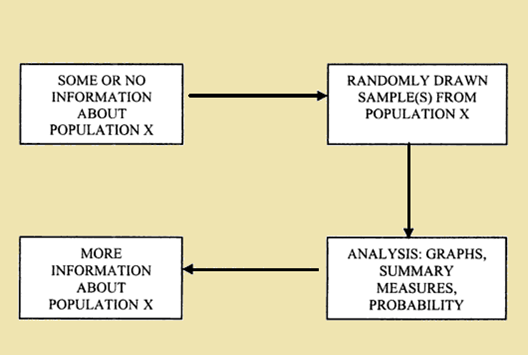
Inferential statistics is used to analyse the results and draw conclusions. Experts described inferential statistics as the mathematics and logic of how this generalization from sample to population can be made (Kolawole, 2001). These procedures might be used to estimate the likelihood that the collected data occurred by chance and to draw conclusions about a larger population from which samples were collected.
Theoretical structure signify that inferential statistics infer from the sample to the population. They determine probability of characteristics of population based on the characteristics of sample and help assess strength of the relationship between independent (causal) variables, and dependent (effect) variables.
Inferential statistics is strongly associated with the logic of hypothesis testing. A hypothesis is an empirically verifiable declarative statement concerning the relationship between independent and dependent variables and their corresponding measures. In hypothesis testing, main aim is usually to reject the null hypothesis. Hypothesis testing is an inferential procedure that uses sample data to evaluate the credibility of a hypothesis about a population.
Hypotheses are stated in two ways. A null hypothesis is a statement which denies that there is a statistical difference between the status quo and the experimental condition. It states that the independent variable being studied makes no difference to the end result. The null hypothesis is the null condition, no difference between means or no relationship between variables. Data are collected that allow to decide if statistician can reject the null hypothesis, and do so with some confidence that he is not making a mistake. The alternative hypothesis (H1) would be that there is a relationship between the two variables.
Fundamentally, all inferential statistics procedures are the same as they seek to determine if the observed (sample) characteristics are sufficiently deviant from the null hypothesis to justify rejecting it.
Flow chart of inferential statistics (Source: Asadoorian, 2015)

The ingredients for making this calculation are the same for all statistical procedures:
- The size of the observed difference(s)
- The variability in the sample
- The sample size.
Procedure for Performing an Inferential Test:
There are many steps to do inferential statistics.
- Start with a theory
- Make a research hypothesis
- Operationalize the variables
- Identify the population to which the study results should apply
- Form a null hypothesis for this population
- Collect a sample of children from the population and run the study
- Perform statistical tests to see if the obtained sample characteristics are sufficiently different from what would be expected under the null hypothesis to be able to reject the null hypothesis.
Reason for using Inferential Statistics
Many top level journals will not publish articles that do not use inferential statistics.It allows analyst to generalize findings to the larger population.
It can determine not just what can happen, but what tends to happen in programs.
Inferential statistics helps assess strength of the relationship between independent (causal) variables, and dependent (effect) variables. It can assess the relative impact of various program.
Inferential statistics can only be used when statistician have a complete list of the members of the population. He draw a random sample from this population. Using a pre-established formula, statistician determine that sample size is large enough.
Inferential statistics can help to determine strength of relationship within sample. Statistician can assess the strength of the impact of independent variables (program inputs) on outcomes (program outputs). In inferential statistics, it is difficult to obtain a population list and/or draw a random sample.
The following types of inferential statistics are extensively used and relatively easy to interpret:
- One sample test of difference/One sample hypothesis test
- Confidence Interval
- Contingency Tables and Chi Square Statistic
- T-test or Anova
- Pearson Correlation
- Bi-variate Regression
- Multi-variate Regression
It can be said that inferential statistics are used to make generalizations from a sample to a population. There are two sources of error that may result in samples being different from the population, from which it is drawn that include sampling error and sampling bias. Inferential statistics are based on taking a random sample from a larger population and attempting to draw conclusions about the larger population from that data and the probability that the relations between measured variables are consistent.

